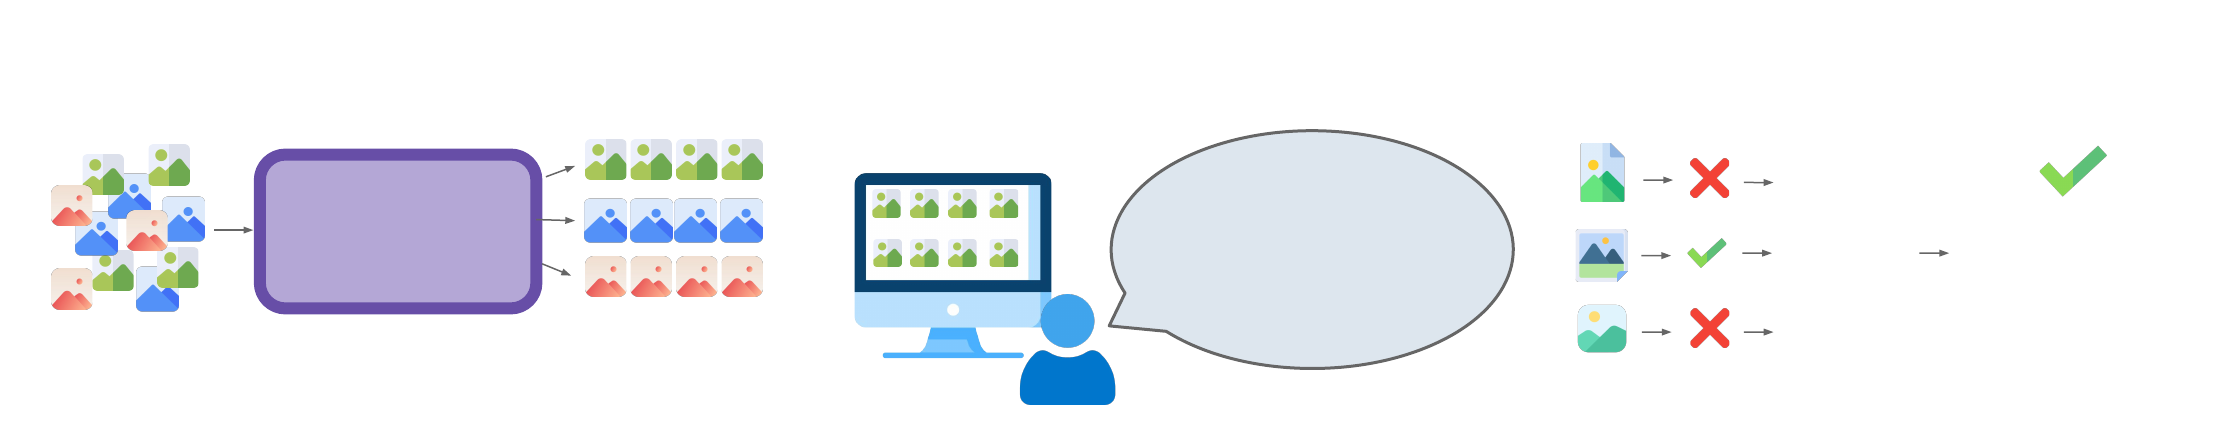
Dimension
Class
Attribute
action
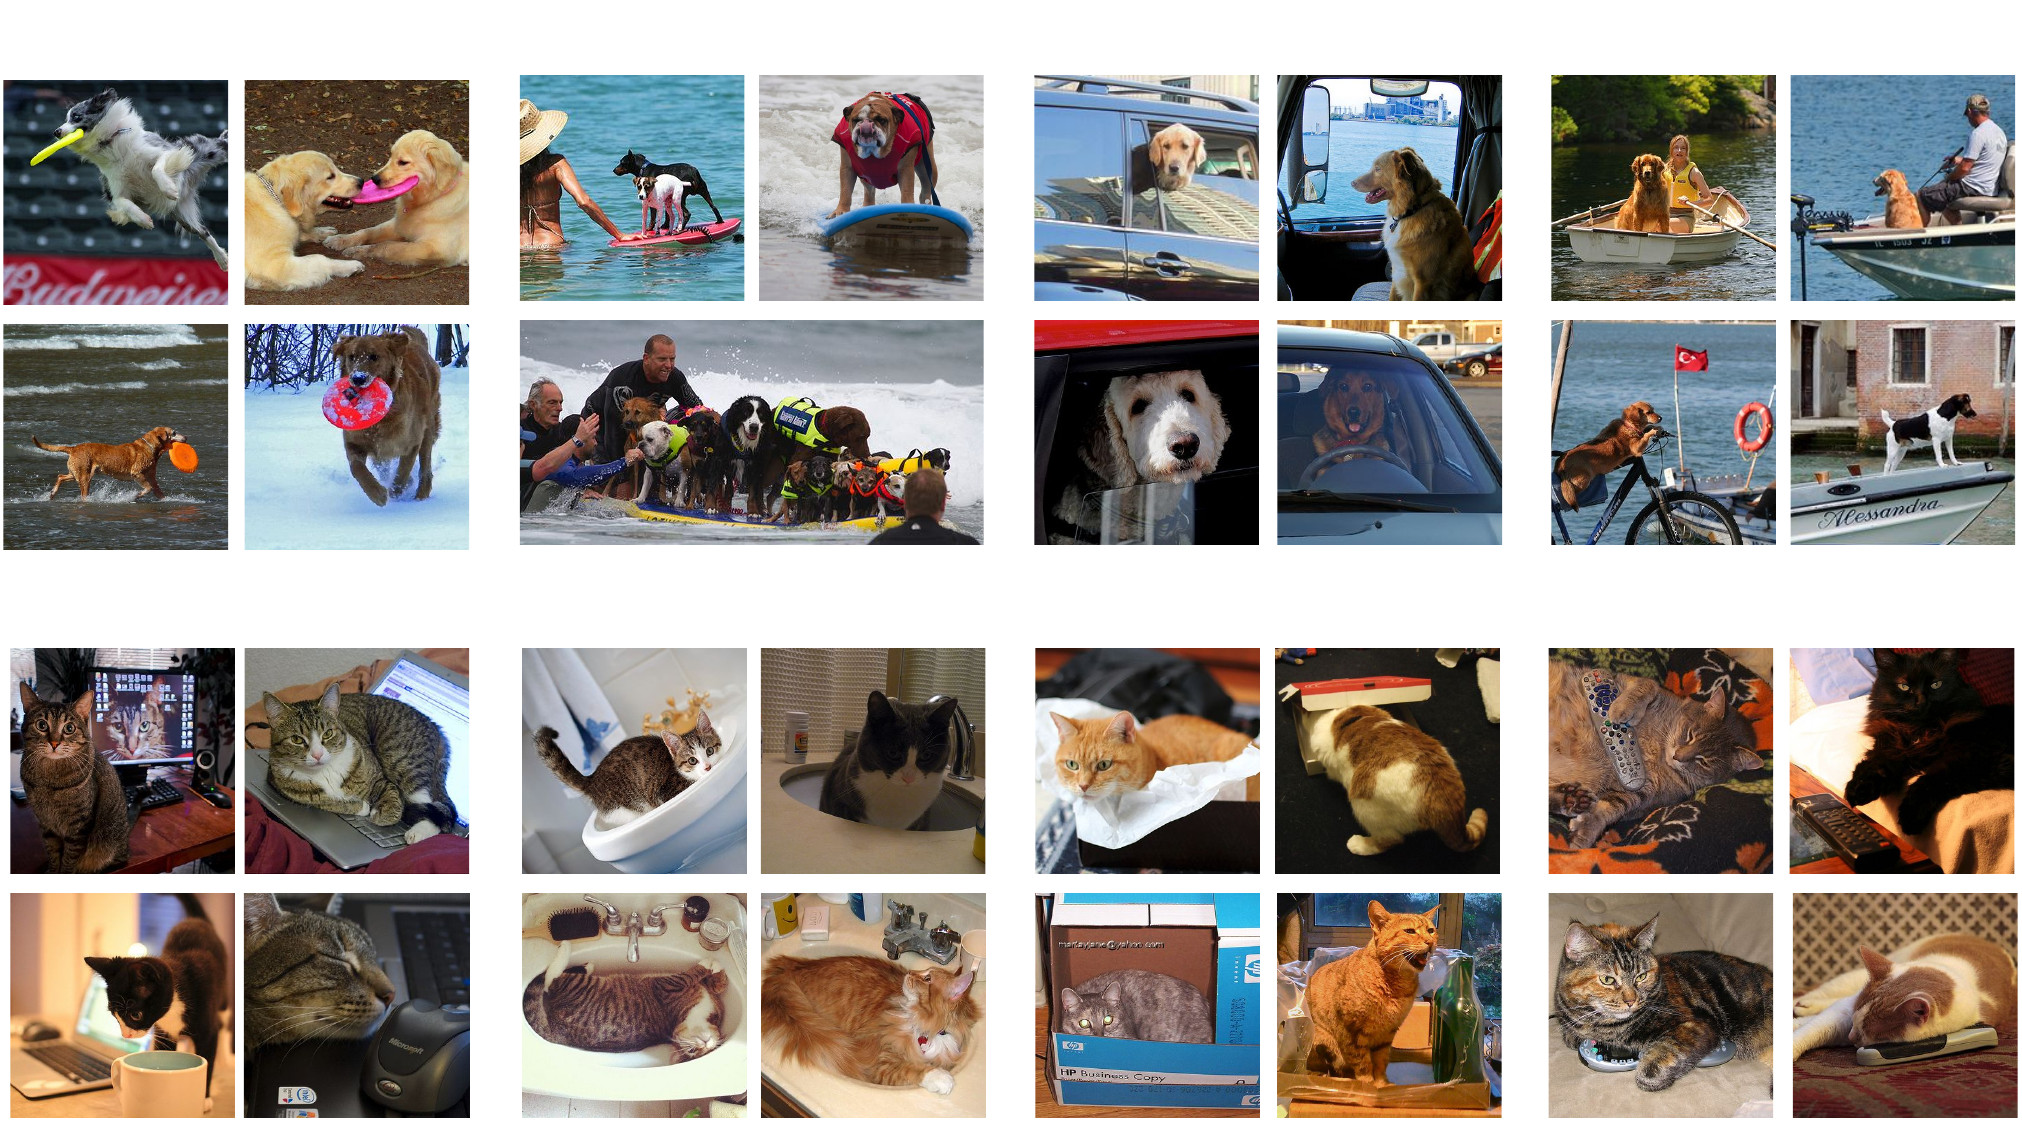
dog
background object
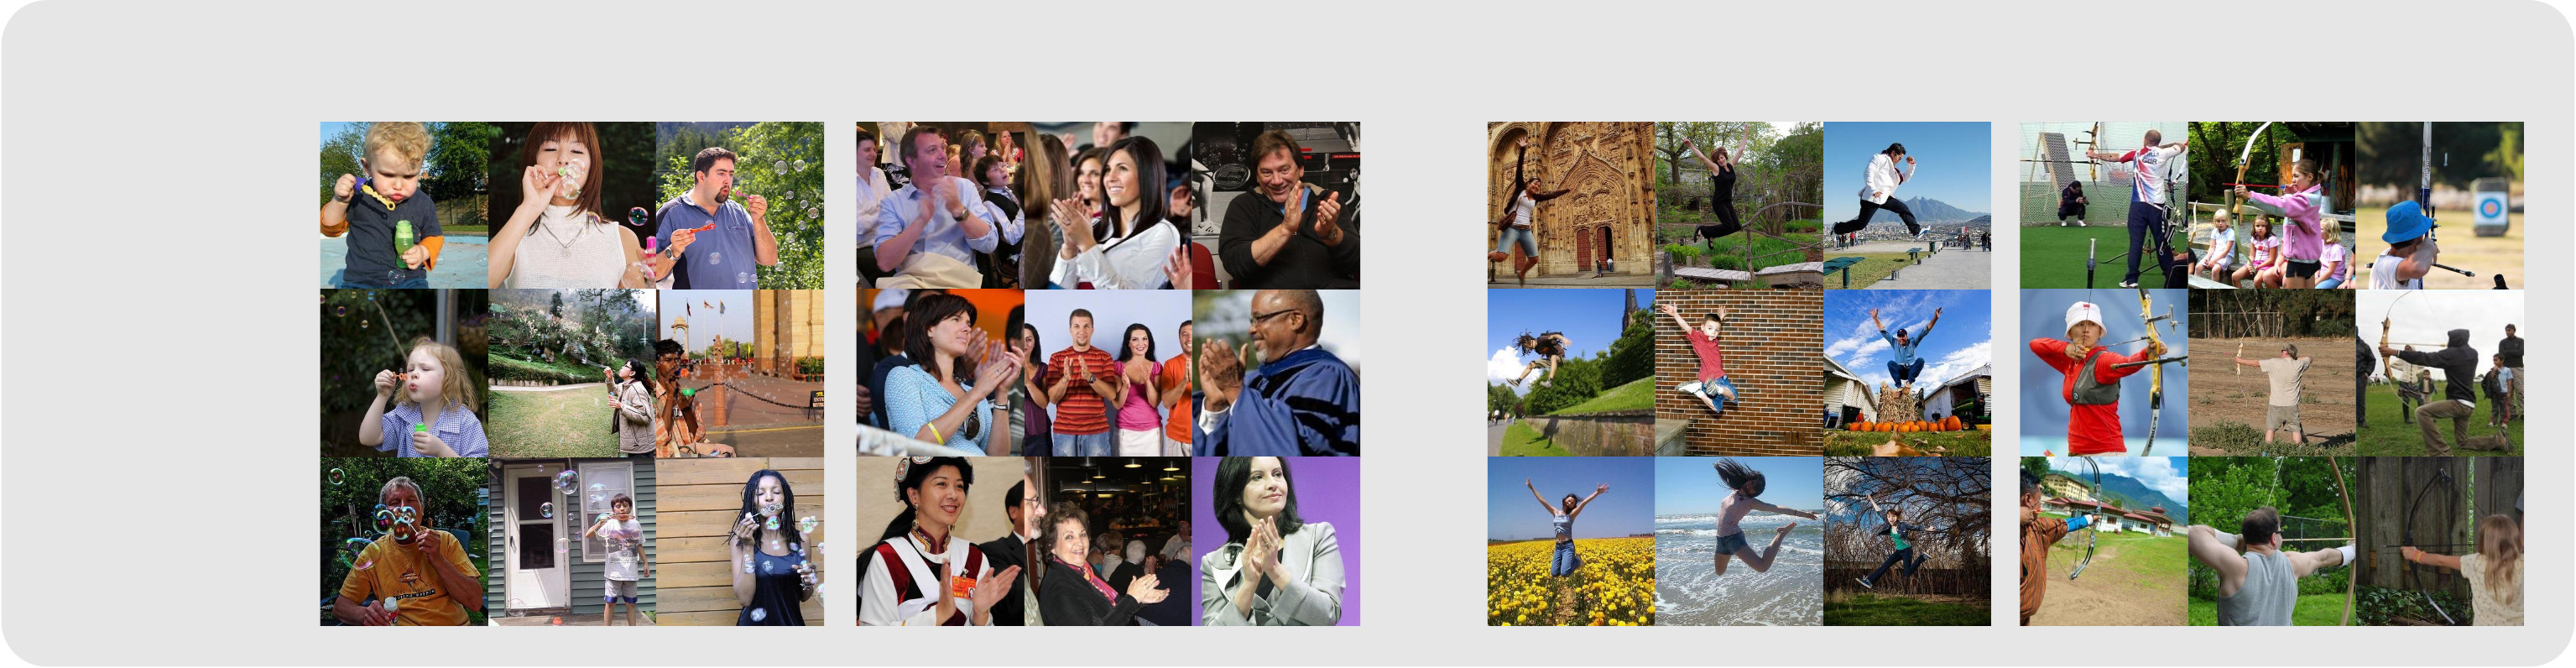
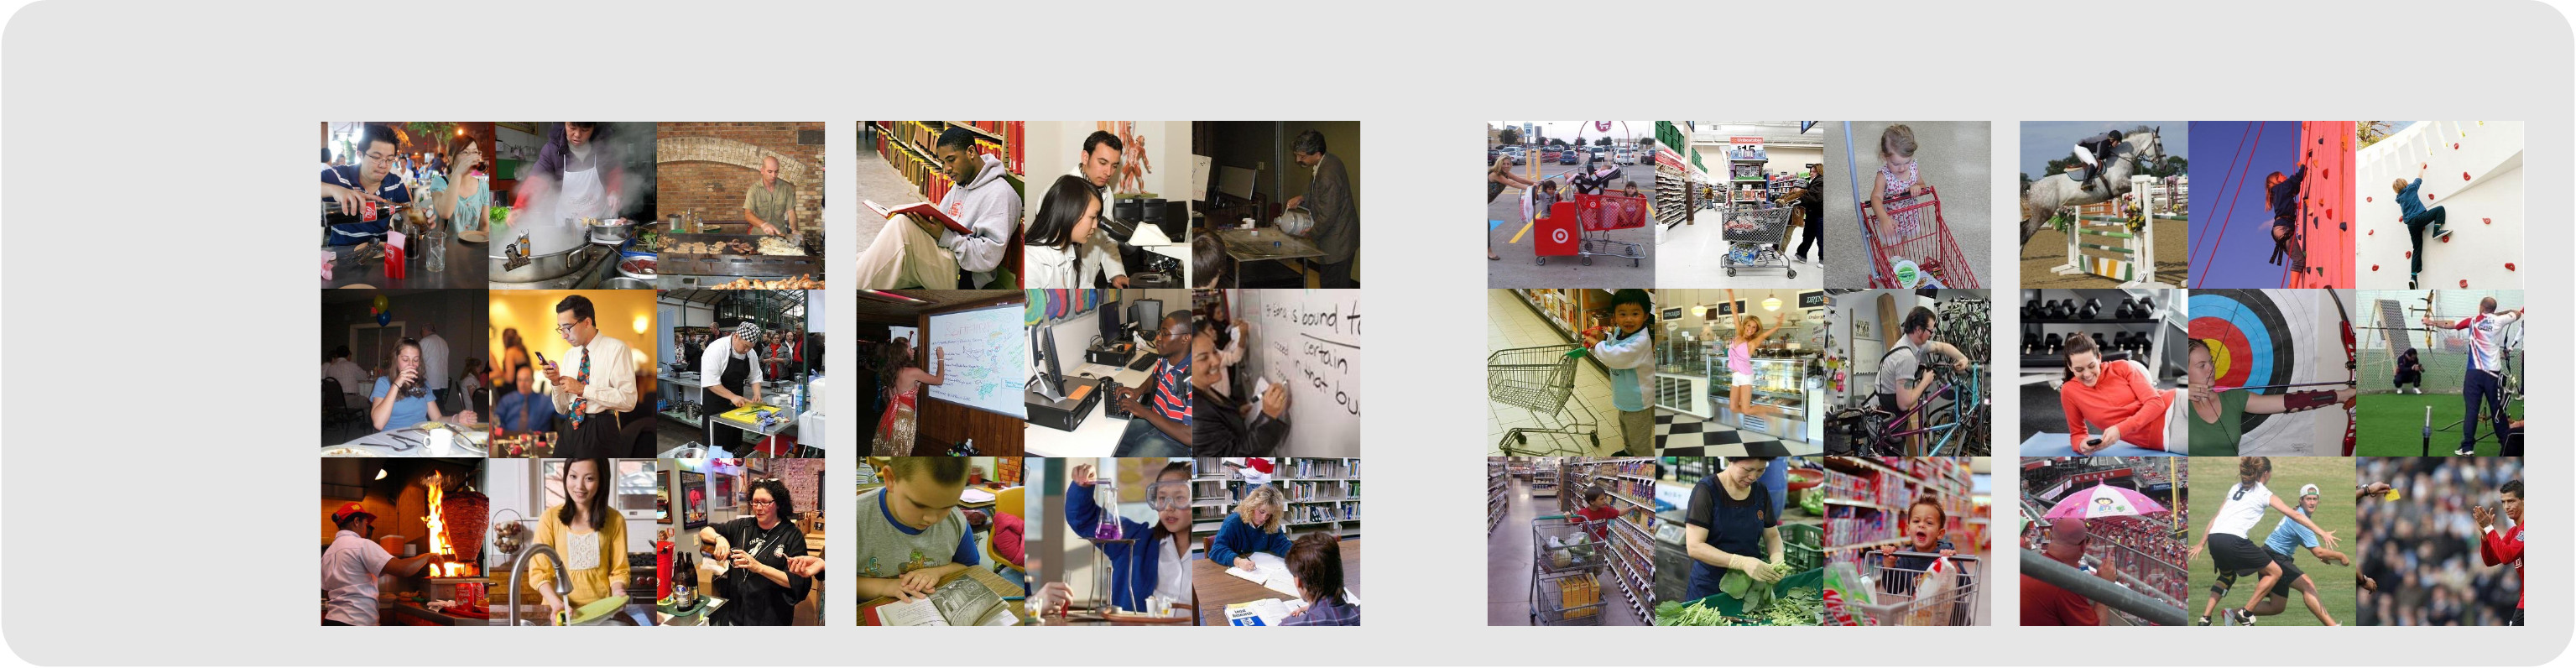
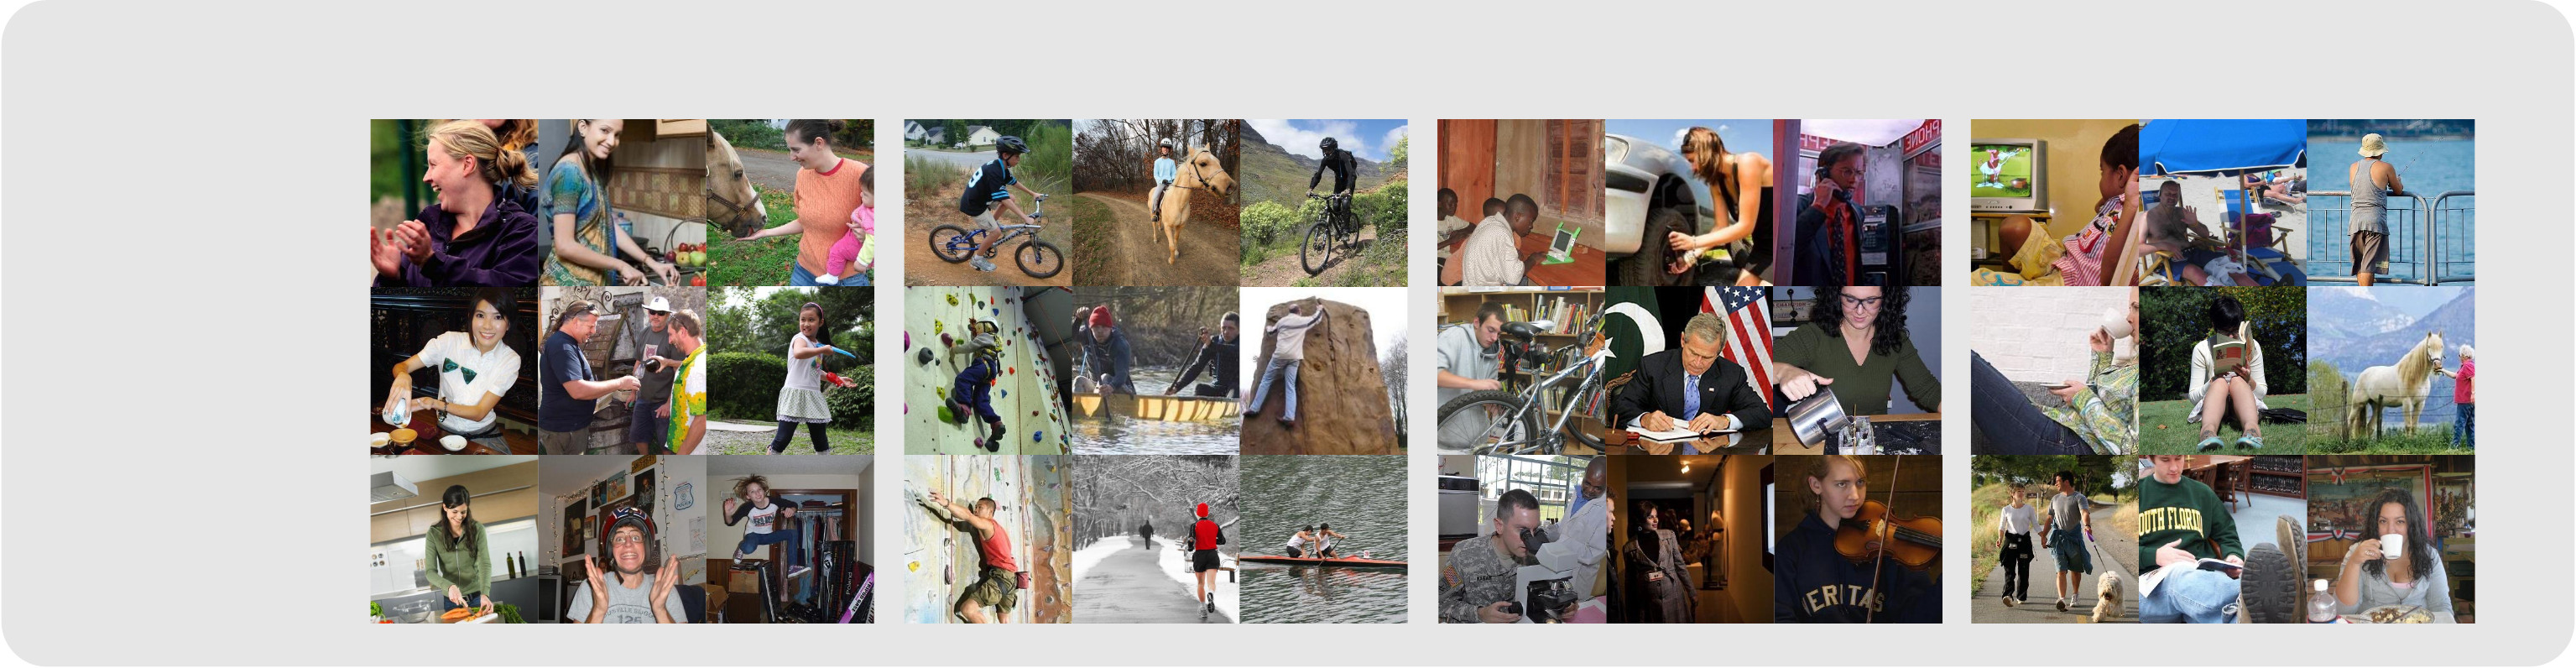
Subpopulation Structure
surf
sit walk water
snow
grass
beach
frisbee
house
Subpopulations
SSD-LLM
Downstream
Tasks
(A) SSD with LLM
Dataset
Criteria
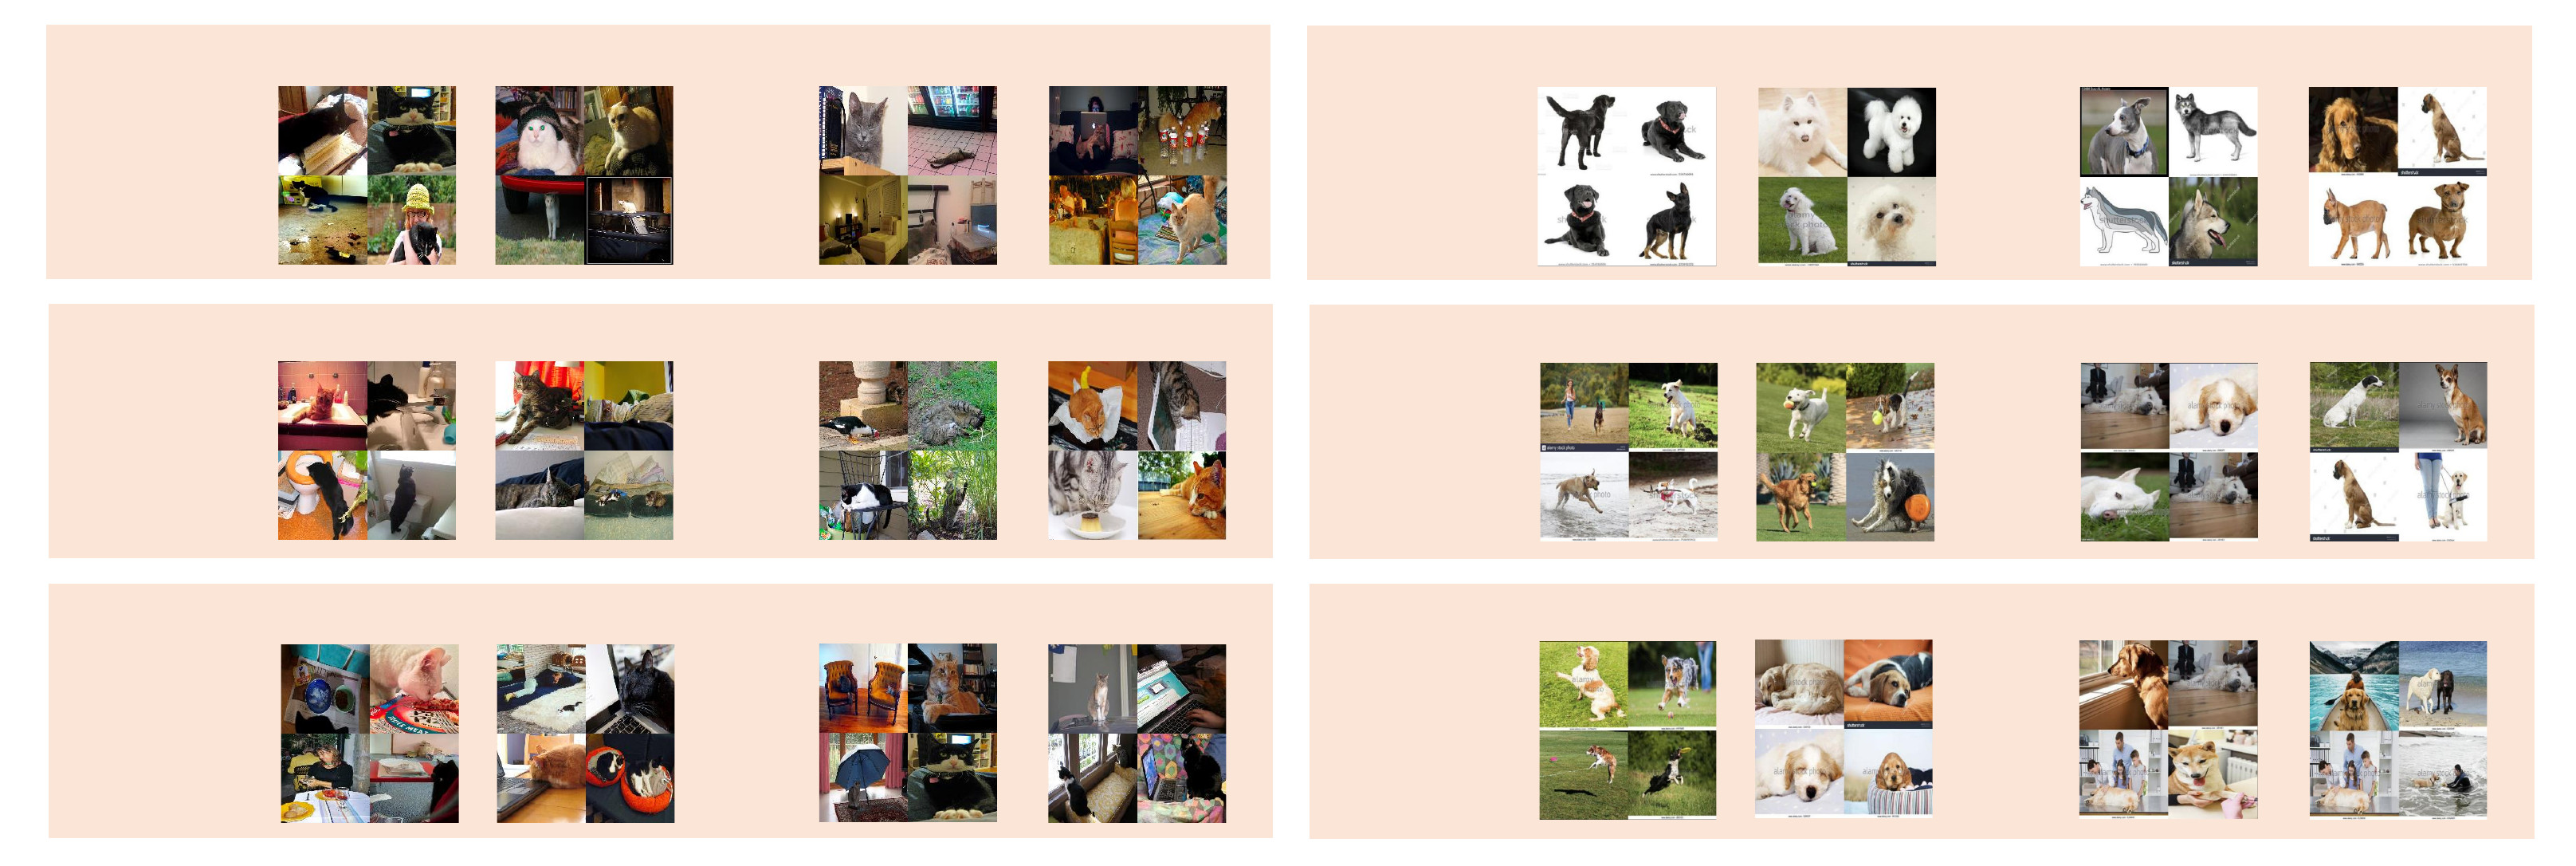
(C) Subpopulation Shift
Better Long-tail Performance
Density
SSD-LLM +
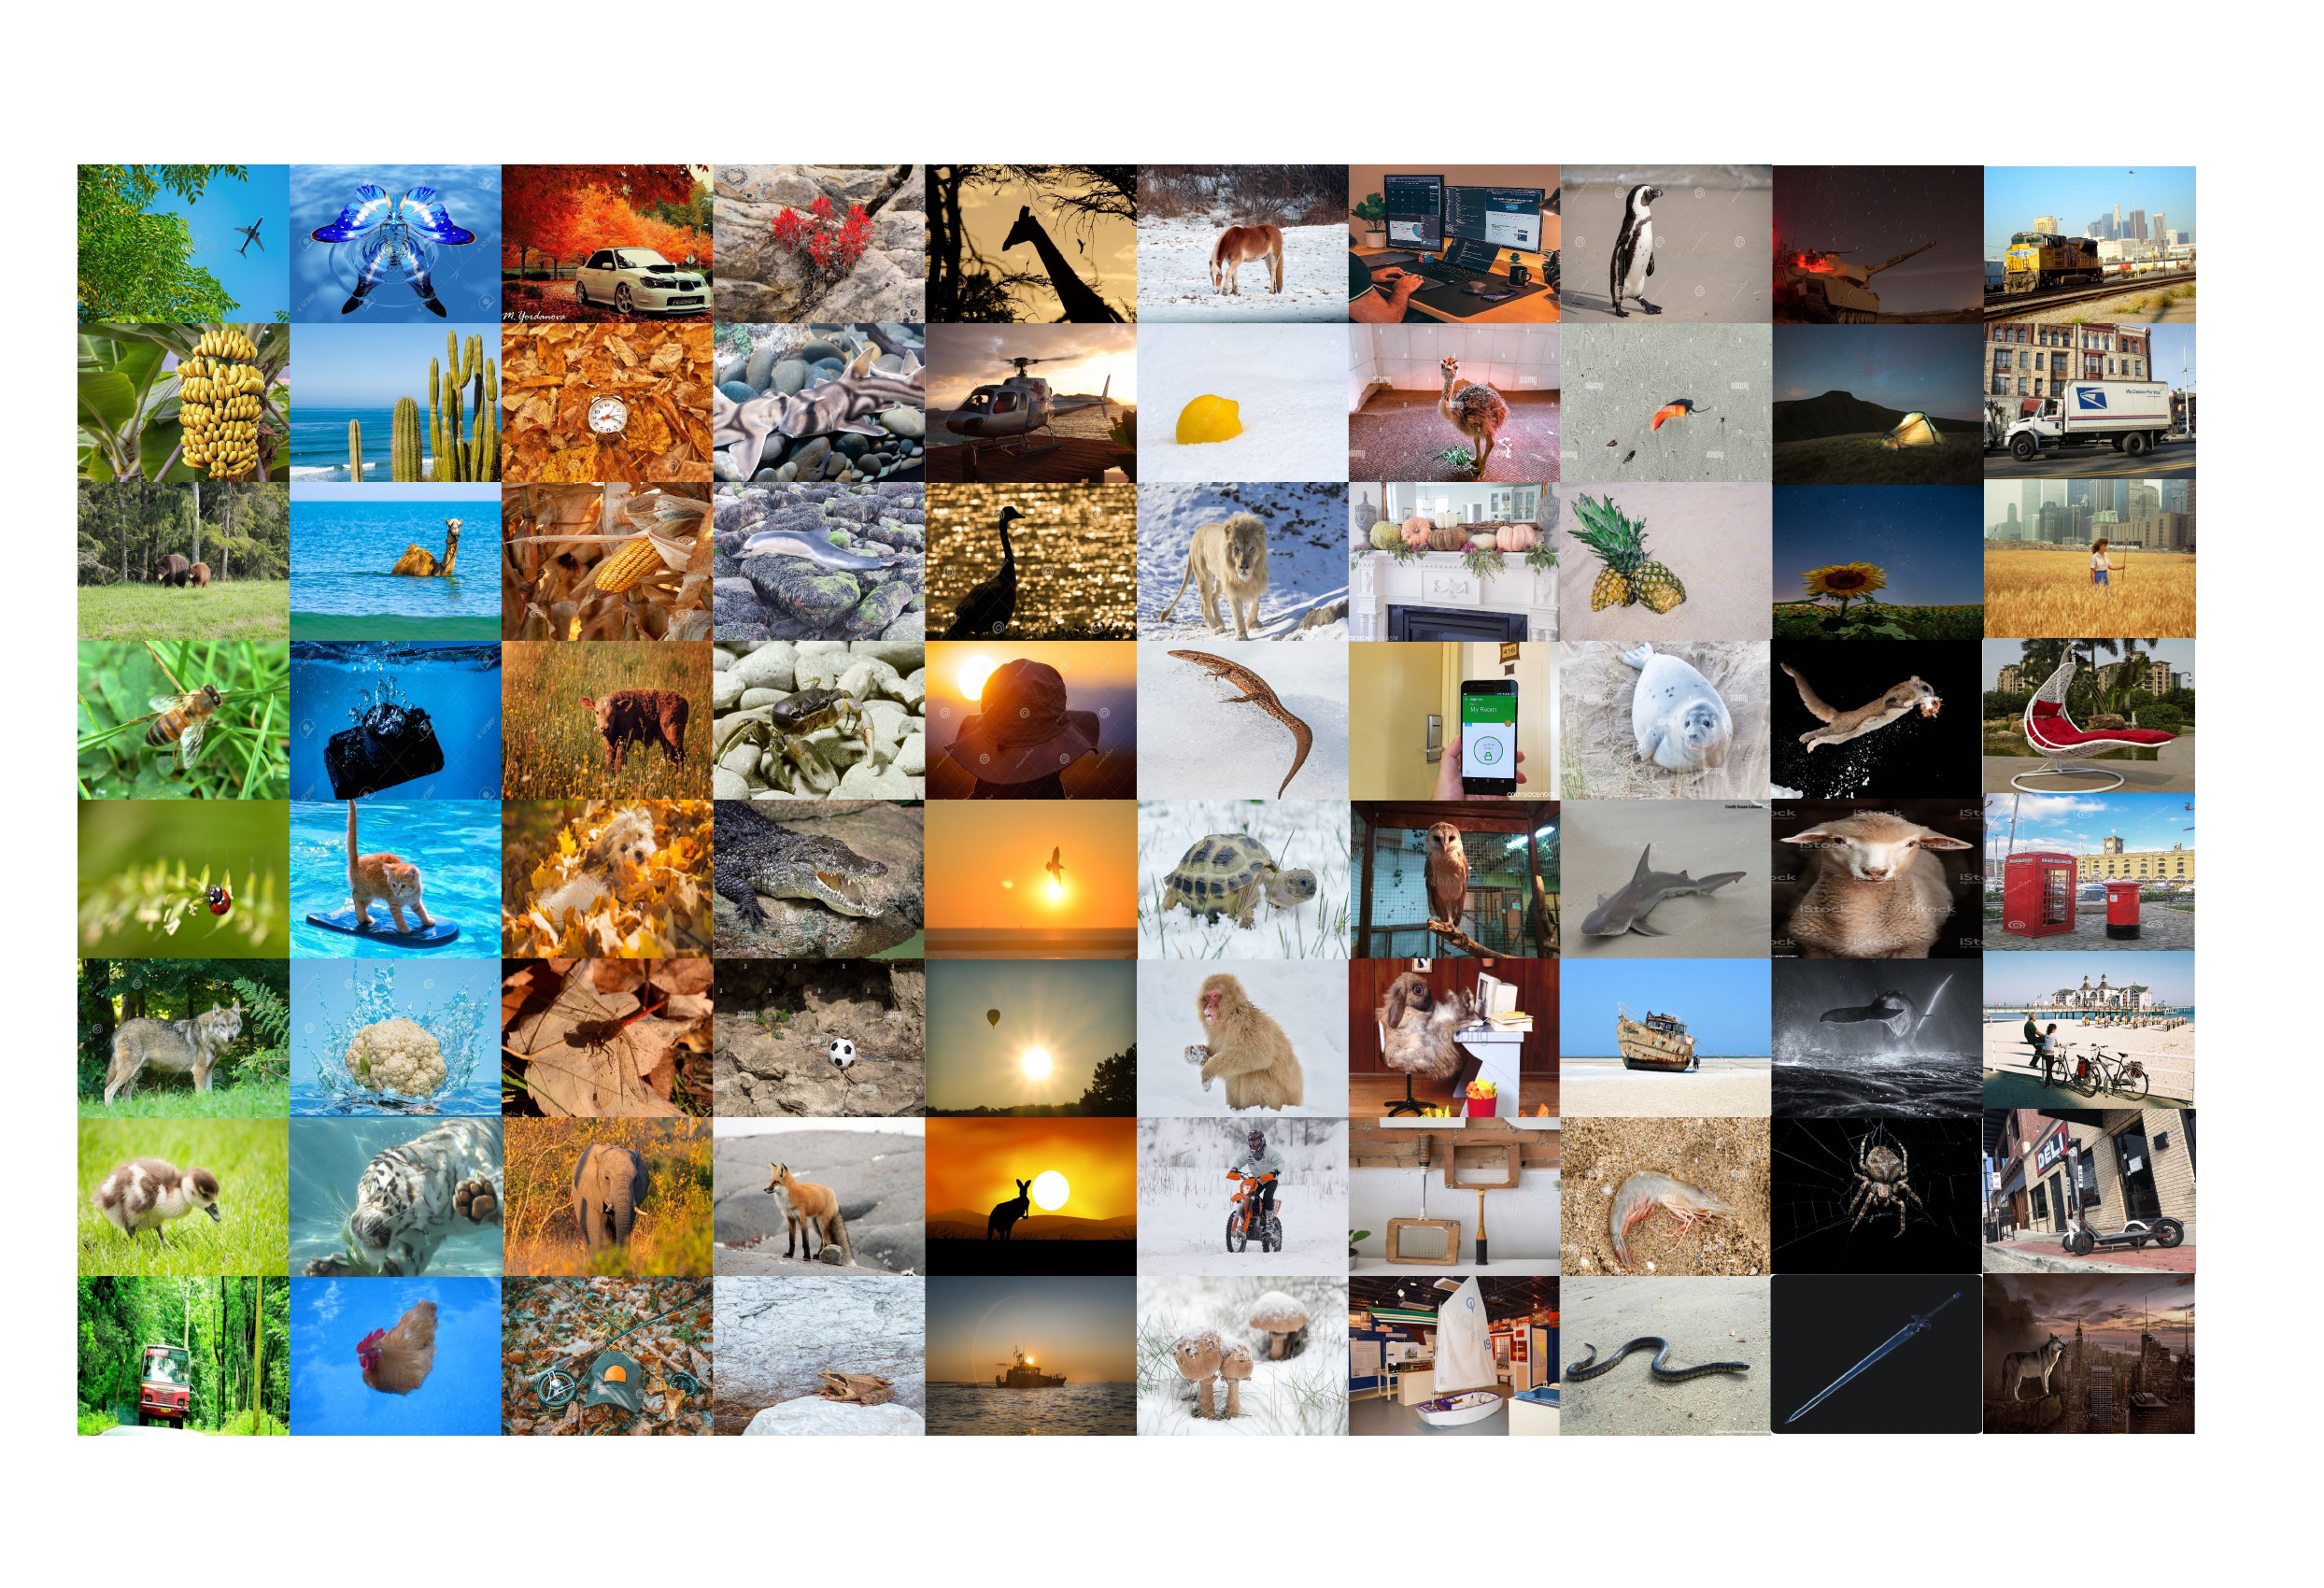
Image Generation
Accuracy
sit
house
surf
…
Model
Model*
sit walk
surf
…
Density
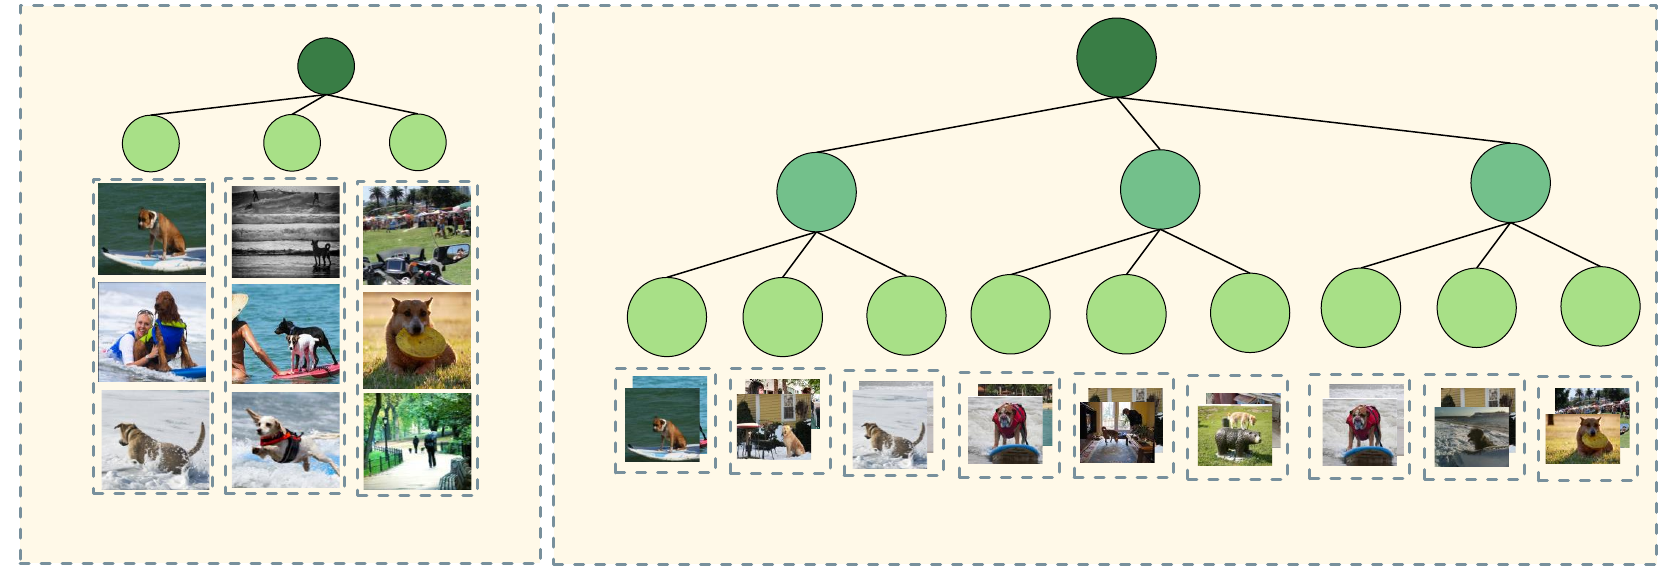
(B) Dataset Subpopulation Organization
Organized Subpopulations
Dimensions
Class
Attributes
Criteria
Dimension:
Action
Dimension:
Background
Surf
Sit
Walk
Water
Snow Grass
Dimension:
Object
Beach
Frisbee House
(D) Slice Discovery
Topic Generation
+ Image Retrieval
Class Dimension Attribute Error Rate
Dog
Action
Lying 25%
Walking 8%
Background
Beach 9%
House 6%
Object
Bed 19%
Boat 27%
Validation accuracy for different attributes
A dog standing on a boat.
Error Rate: 19%
A dog lying in a bed.
Error Rate: 20%
Slices
sit
walk
surf
…
Action
Action
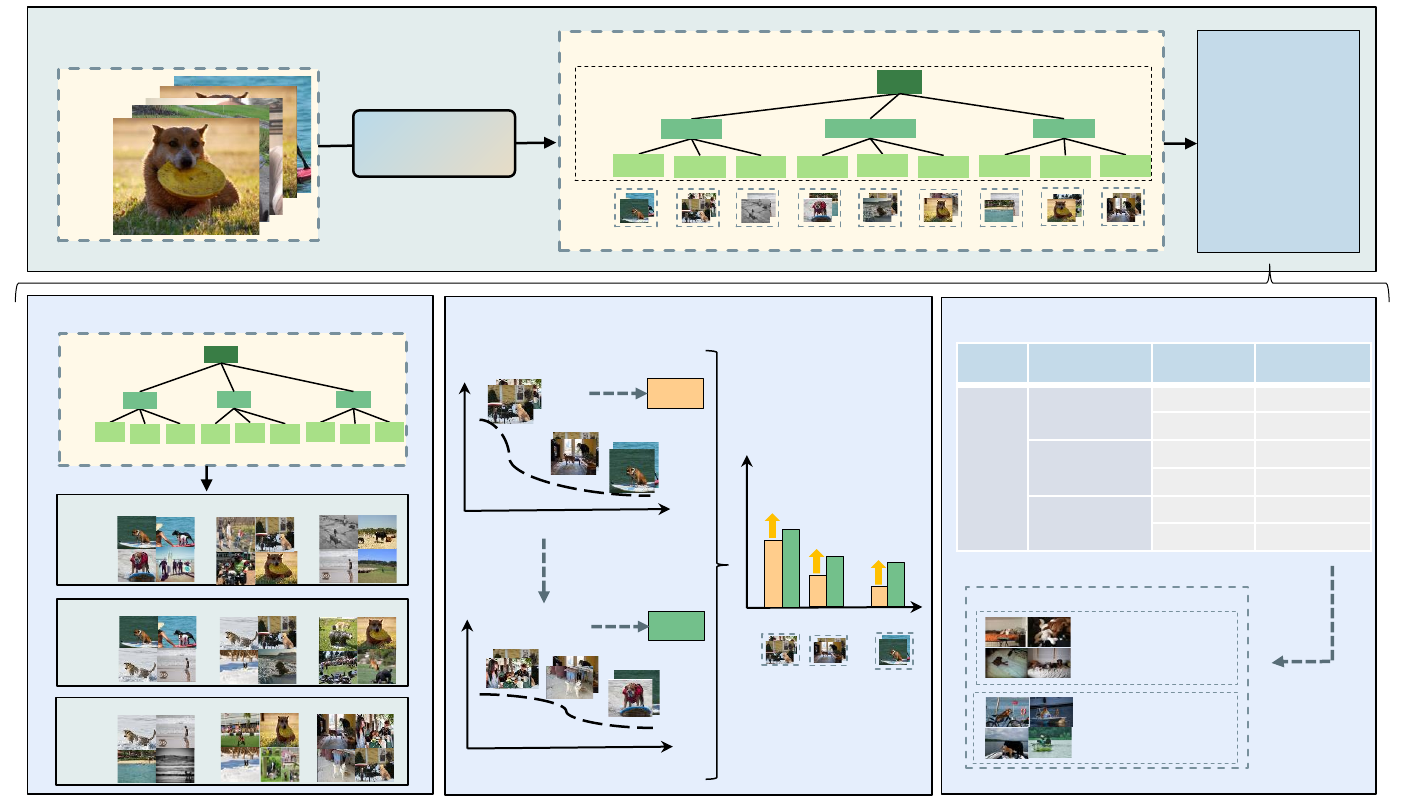
Fig 1: (A) The Workflow of Subpopulation Structure Discovery with Large Language Models (SSD-LLM). SSD-LLM can further support several downstream tasks including: (B) Dataset Subpopulation Organization; (C) Subpopulation Shift; (D) Slice discovery